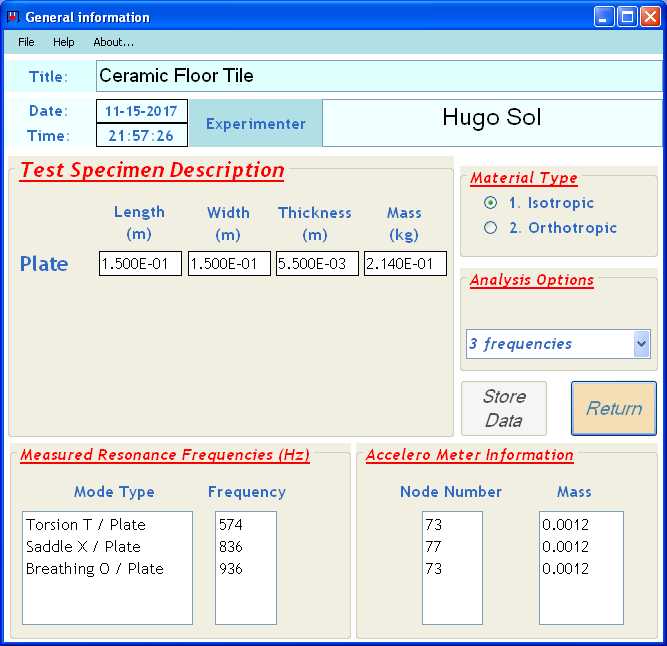
Sizes of the square Tile: 0.15 m x 0.15 m x 0.0055 m
Weight: 0.214 kg
-
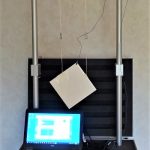
- Diagonal Suspension
-
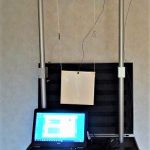
- Vertical Suspension
The resonance frequencies of the torsion and breathing mode shapes can be measured in the most easy way by suspending the test plate diagonally. Fixing the accelerometer in a corner of the plate and tapping with a hammer in (another) corner activates mainly the torsion and the breathing mode shape. Hitting the plate in the center will activate only the breathing mode shape.
The resonance frequency of the saddle mode shape can be measured in the most easy way by suspending the test plate straight. Fixing the accelerometer in the middle of an edge of the plate and tapping with a hammer in the middle of (another) edge activates mainly the saddle mode shape.
An example how the frequencies of a plate can be measured is shown in the example: Measurement Procedure Example
The measured frequencies for the square ceramic tile are:
- Torsional Modeshape: 574 Hz
- Saddle Modeshape: 836 Hz
- Breathing Modeshape: 936 Hz
After measurement of the frequencies, the position (nodes 73, resp 77) and mass of the accelerometer (0.0012 kg) and input of the geometrical data of the test plate, the general data screen of the Resonalyser program looks like:
The figure below shows a screenshot of the obtained result screen for the floor Tile with the Engineering Constants E (Young’s Modulus), v (Poisson’s ratio) and G (In-plane Shear Modulus), the plate rigidities D, D12 and D66 and uncertainty bounds on the identified plate rigidities. The plate rigidities for isotropic materials are (t = plate thickness):
Data Sheet of the Ceramic Tile
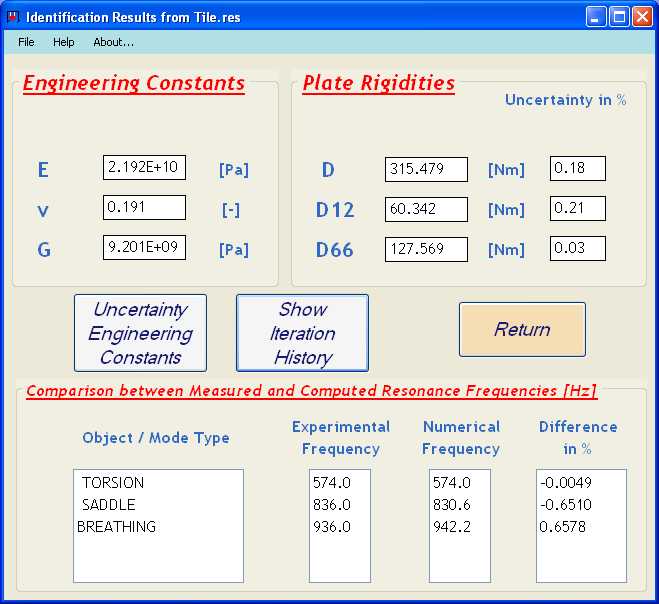
Plate Rigidities and Engineering Constants as final result
The computed uncertainties on the plate rigidities (and hence on the Engineering constants) are very small. This indicates that the quality of the used test plate was very good. A summary report of the data and the results is automatically stored in a .TXT File. Because the plate rigidity D of an isotropic material has the same in all directions, a square test plate qualifies as “Poisson plate”. The report file for this example is given below. It can be seen that the Experimental frequencies and the Numerical frequencies match well. This indicates that the quality of the test Tile is good (homogeneous material properties all over the plate area)