Description: Glass textile reinforced epoxy plate
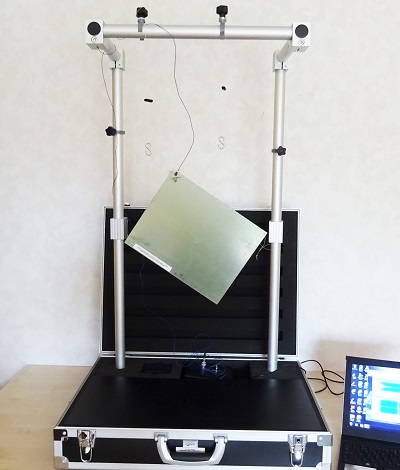
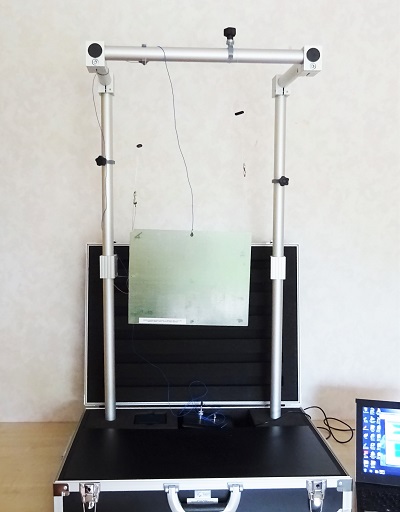
The first step in the resonalyser procedure for the identification of orthotropic engineering constants of composite material is to define the correct aspect ratio for a “Poisson” plate. This information can be obtained by measuring the resonance frequencies of two beams cut along the plate edges. The beams cut along the 1-direction (Beam 1) and the 2-direction (Beam 2) have the following dimensions:
Beam 1: Length 0.2913 m, Width 0.02439 m, Thickness 0.00442 m, Mass 0.05857 kg
Beam 2: Length 0.3023 m, Width 0.02447 m, Thickness 0.00449 m, Mass 0.06127 kg
The measured resonance frequency for Beam 1 had a value of 232.4 Hz and for Beam 2 a value of 135.8 Hz.
With the above information, the aspect ratio for a Poisson plate could be computed as 1.26. The plate was cut according to this aspect ration with the following dimensions:
Test plate (“Poisson” plate): Length 0.2653 m, Width 0.2122 m, Thickness 0.00455 m, Mass 0.46333 kg
The 3 first measured resonance frequencies of this plate are:
- Torsional Modal shape (measured in diagonal suspension – accelm. in node 81): 130.1 Hz
- Saddle Modal shape (measured in vertical suspension- accelm. in node 77): 268.6 Hz
- Breathing Modal shape (measured in diagonal suspension-accelm. in node 81): 301.6 Hz
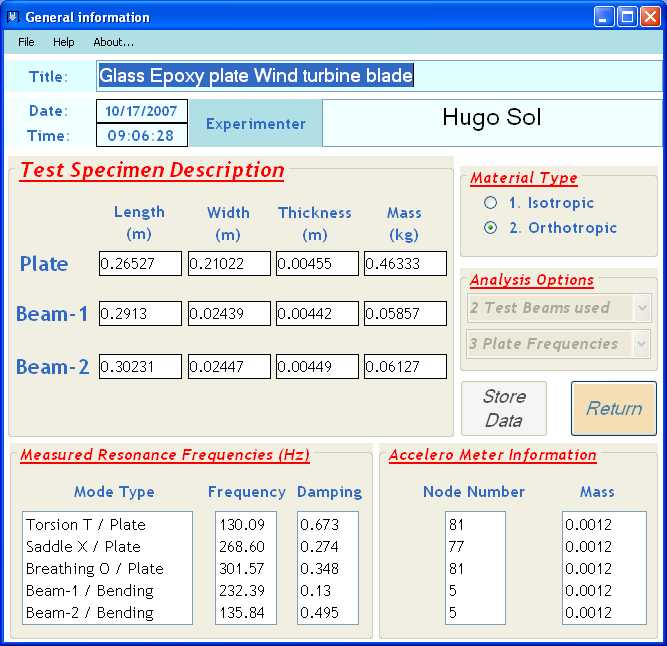
The completed information of the general information screen is shown below.
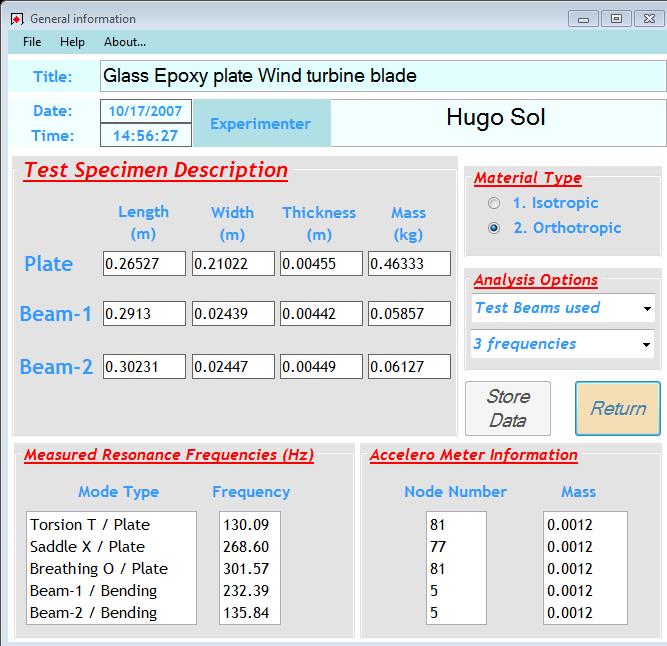
General Information Screen of the Resonalyser software
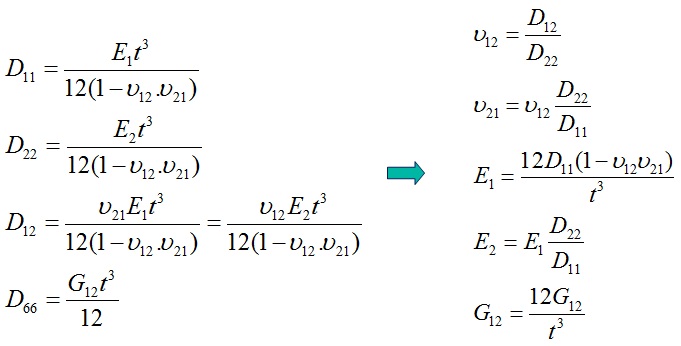
With this information, the resonalyser procedure can compute the orthotropic plate rigidities and thus the Engineering constants. The relationship between the plate rigidities and the engineering constants is shown below (t = plate thickness).
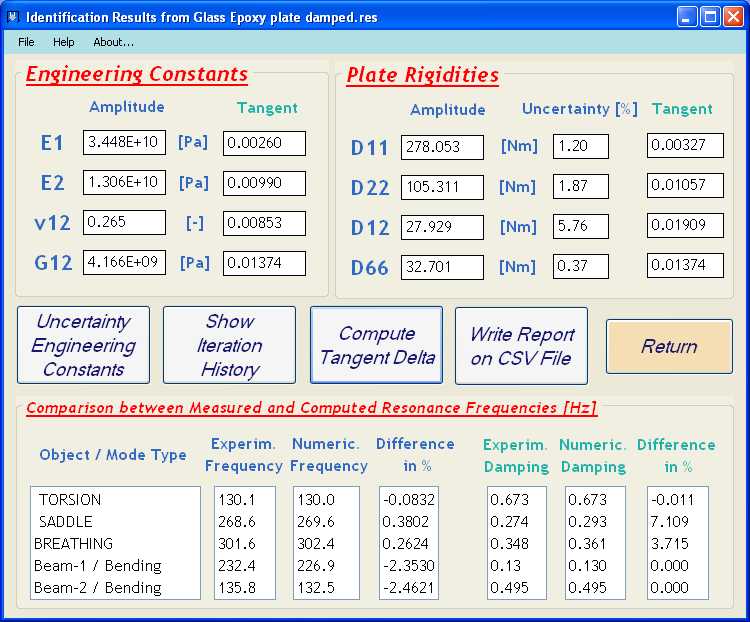
The figure below shows a screenshot of the obtained results for the Glass epoxy plate with the Engineering Constants E1 (Young’s Modulus in the 1-direction), v12 (Poisson’s ratio) and G12 (In-plane Shear Modulus), the plate rigidities D11, D22, D12 and D66 and uncertainty bounds on the identified plate rigidities.
-
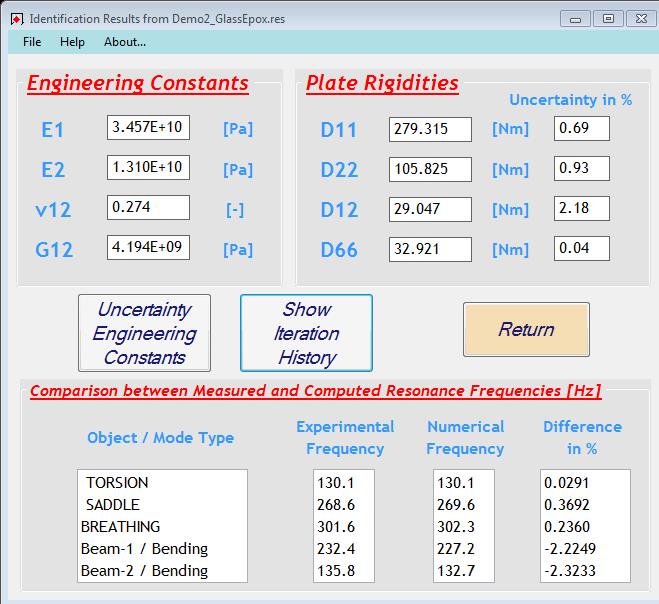
- Obtained Plate rigidities and Engineering constants
-
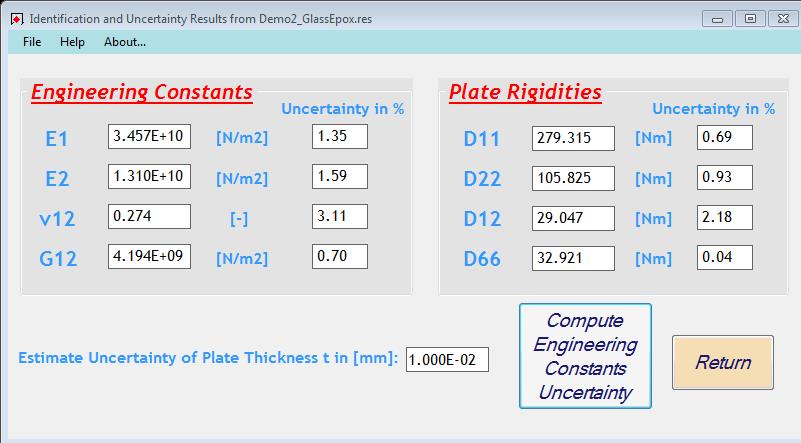
- Uncertainty on Engineering constants
The computed uncertainties on the plate rigidities (and hence on the Engineering constants) are small. A summary report of the data and the results is automatically stored in a .TXT File. The report file for this example is given below. It can be seen that the Experimental frequencies and the Numerical frequencies match well. This indicates that the quality of the test plate is good (homogeneous material properties all over the plate area)
Identification of the complex engineering constants
Additional computation of the imaginary part of the Engineering constants (damping) is possible if the damping ratio of the test beams and the damping ratio of the plate frequencies is available. The figure below shows the measured damping ratios of the above example.
With these extra information, the Resonalyser software can compute the full complex engineering constants (amplitude and tangent delta).