Description: Hot rolled commercial 6082 Aluminum Alloy
The first step in the resonalyser procedure for the identification of orthotropic engineering constants is to define the correct aspect ratio for a “Poisson” plate. This information can be obtained by measuring the resonance frequencies of two beams cut along the plate edges. The beams cut along the 1-direction (Beam 1) and the 2-direction (Beam 2) have the following dimensions:
Beam 1: Length 0.3 m, Width 0.024 m, Thickness 0.005 m, Mass 0.0972 kg
Beam 2: Length 0.3 m, Width 0.024 m, Thickness 0.005 m, Mass 0.0972 kg
The measured resonance frequency for Beam 1 had a value of 296.5 Hz and for Beam 2 a value of 294.6 Hz. The aspect ratio is hence very close to 1 (isotropic material). With the above information, the aspect ratio for a Poisson plate could be kept approximately as 1 (thus square as for a perfect isotropic plate). The square plate was cut according to this aspect ratio with the following dimensions:
Test plate (“Poisson” plate): Length 0.3 m, Width 0.3 m, Thickness 0.005 m
Weight: 1.215 kg
-
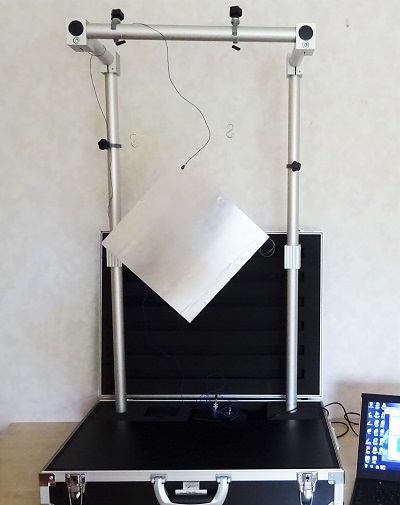
- Diagonal suspension
-
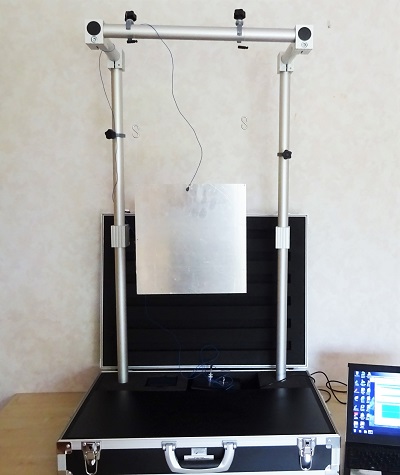
- Vertical suspension
The resonance frequencies of the torsion and breathing mode shapes can be measured in the most easy way by suspending the test plate diagonally. Tapping and measuring in a corner of the plate activates mainly the torsion and the breathing mode shape. Hitting the plate in the center will activate only the breathing mode shape.
The resonance frequency of the saddle mode shape can be measured in the most easy way by suspending the test plate straight. Tapping and measuring in the middle of an edge of the plate activates mainly the saddle mode shape. In this example, the frequencies were measured with a microphone, hence there was no mass loading.
The 3 first measured resonance frequencies of this plate are:
- Torsional Modal shape (measured in diagonal suspension): 177.8 Hz
- Saddle Modal shape (measured in vertical suspension): 269.5 Hz
- Breathing Modal shape (measured in diagonal suspension): 340.9 Hz
The completed information of the general information screen is shown below.
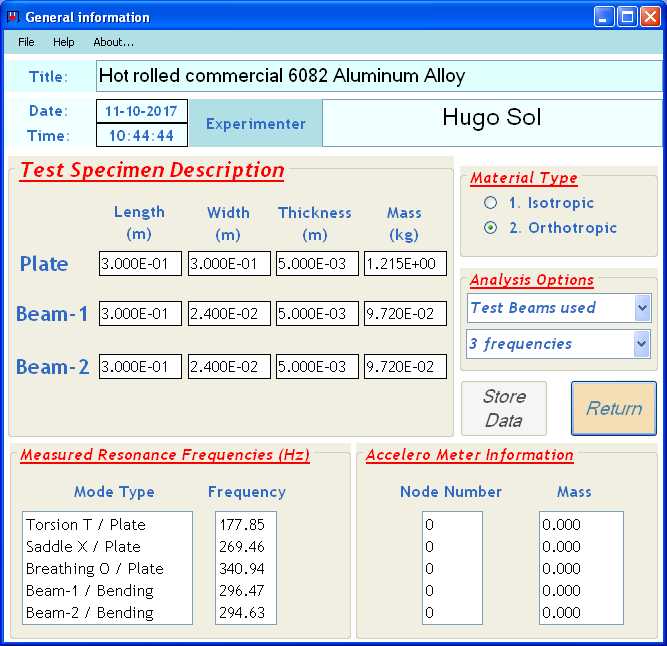
Complete data sheet of test beams and test plate
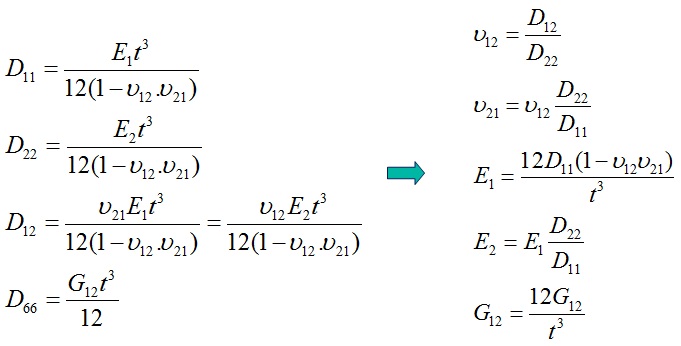
With this information, the resonalyser procedure can compute the orthotropic plate rigidities and thus the Engineering constants. The relationship between the plate rigidities and the engineering constants is shown below (t = plate thickness).
The figure below shows a screenshot of the obtained results for the Engineering Constants E1 (Young’s Modulus in the 1-direction), v12 (Poisson’s ratio) and G12 (In-plane Shear Modulus), the plate rigidities D11, D22, D12 and D66 and uncertainty bounds on the identified plate rigidities.
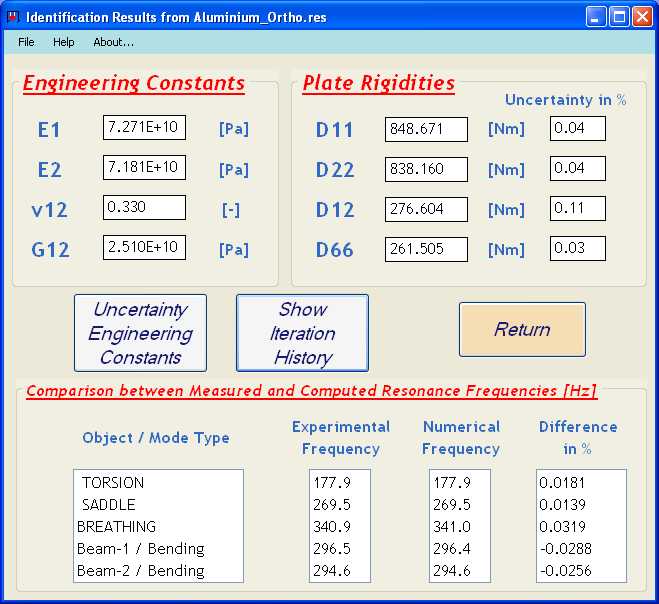
Identified Plate Rigidities and Engineering Constants
It can be seen that the Experimental frequencies and the Numerical frequencies match very well. This indicates that the quality of the test plate is good (homogeneous material properties all over the plate area) and that more accurate results are obtained by considering the plate as orthotropic instead of isotropic (see Isotropic Aluminum example). As a consequence, the computed uncertainties on the orthotropic plate rigidities are very small.
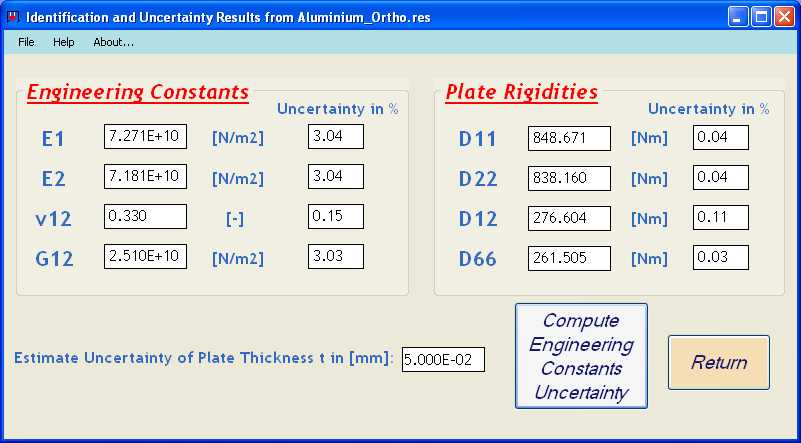
Final Results: Engineering Constants and estimated Uncertainties of Aluminum considered as Orthotropic Material
The uncertainty of the thickness value can be entered by the user as an additional source of uncertainty. It can be seen in the results for the uncertainty of the Engineering constants in the above screen shot that an assumed uncertainty of 1% (0.05 mm) on the thickness cause immediately a larger uncertainty for the engineering constants (3%). This is due to the fact that the thickness appears to the third power in the above given formulas for the plate rigidities.
More details about this example can be found in a published journal: Metal plates NDTE 2003
A summary report of the data and the results is automatically stored in a .TXT File. The report file for this example is given below.