1) Measurement of the frequencies associated with torsion and breathing modal shapes
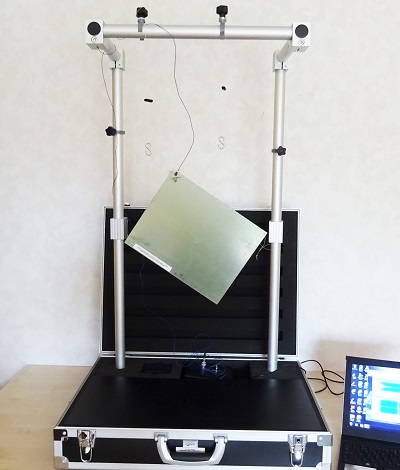
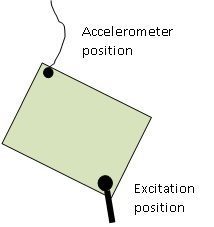
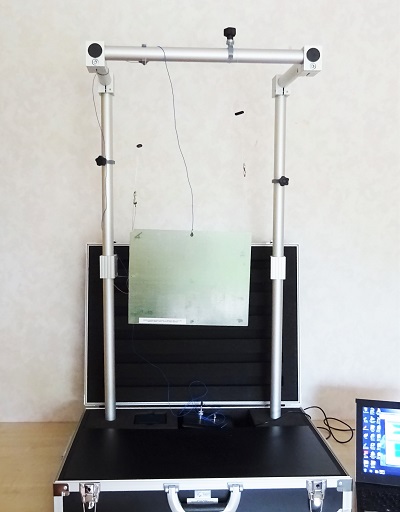
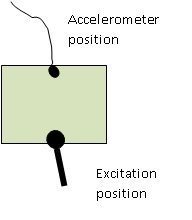
Diagonal suspension of the plate. Fix the accelerometer in one of the corners of the plate and excite the plate in another corner.
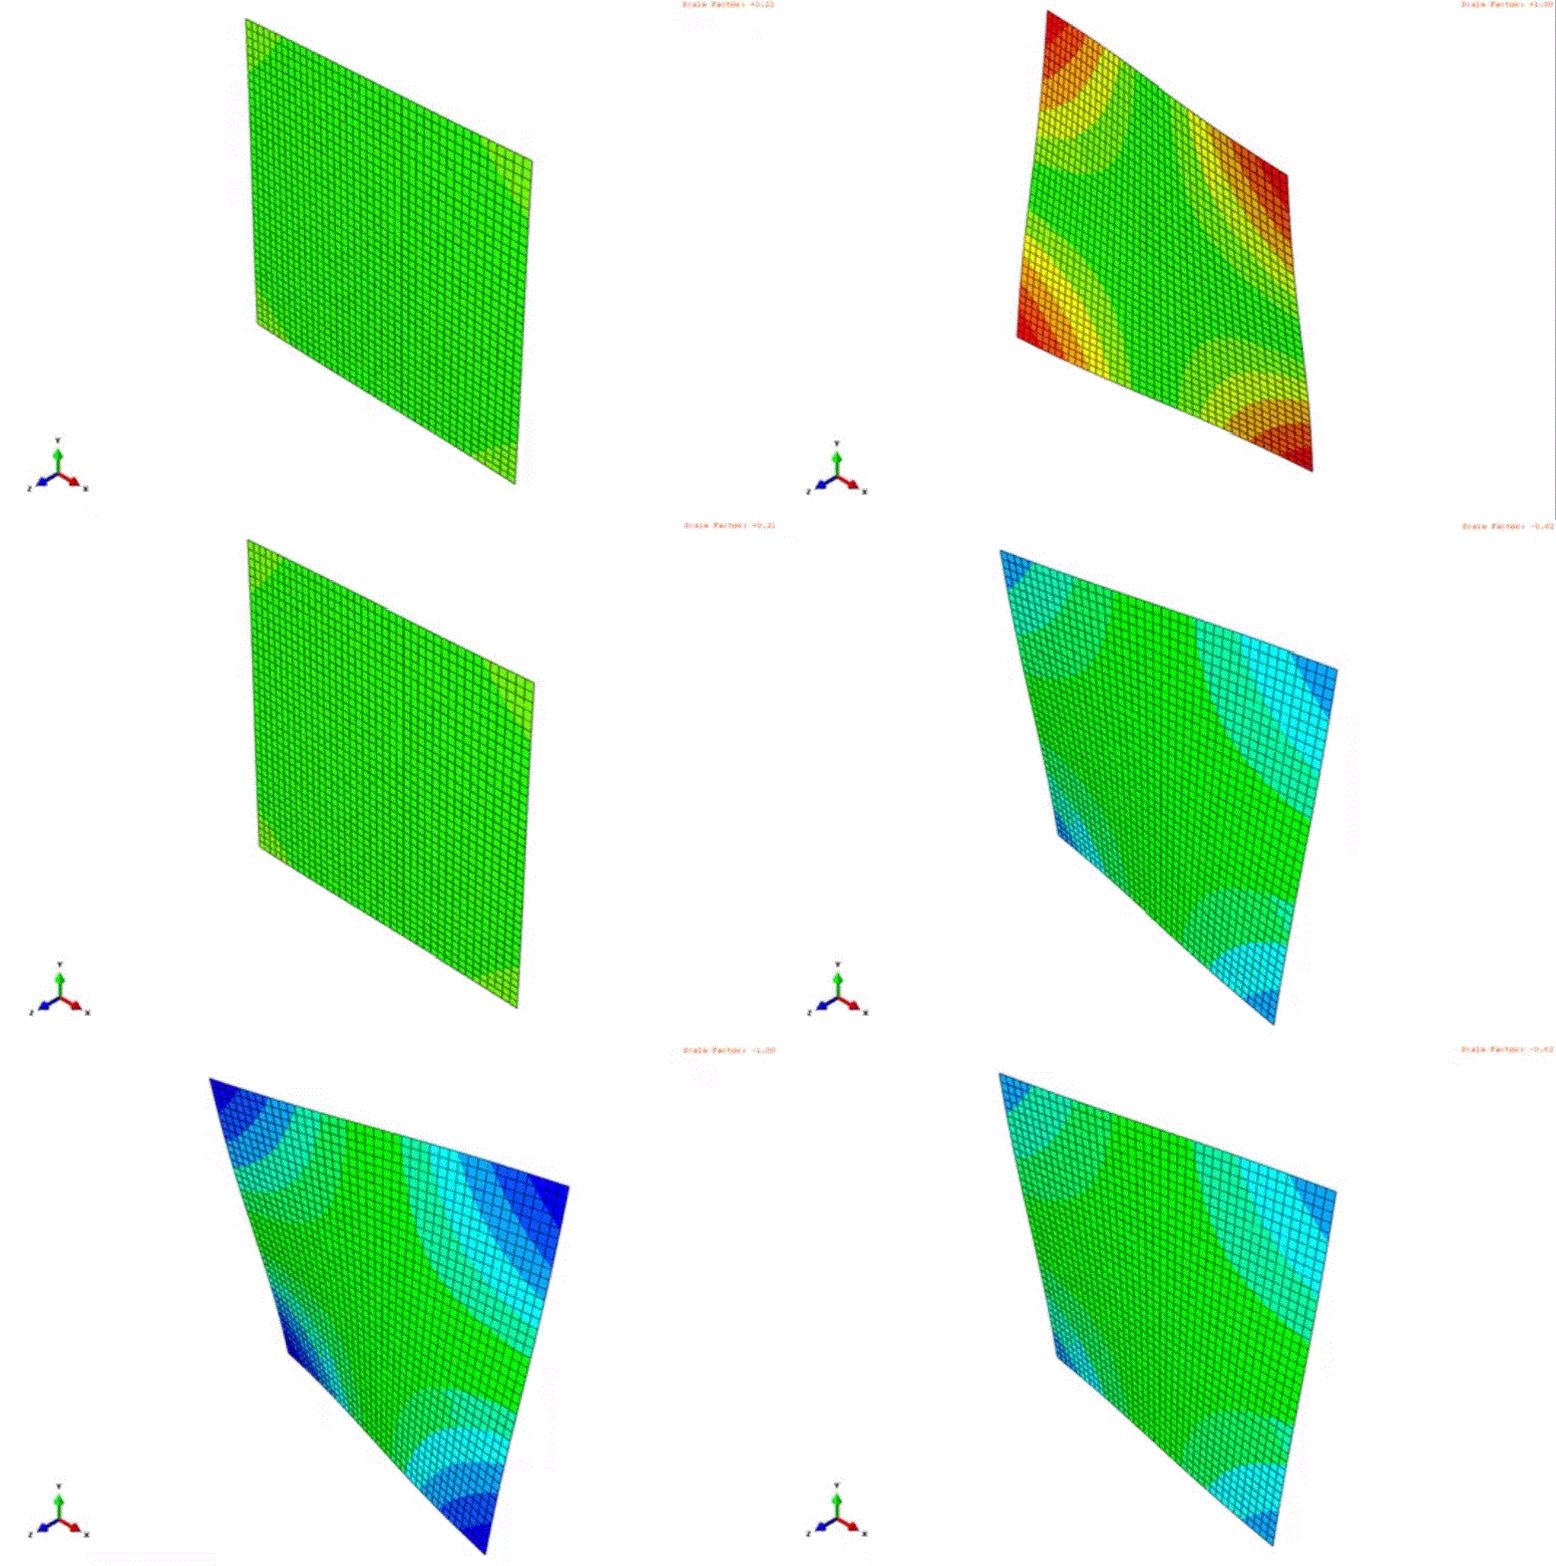
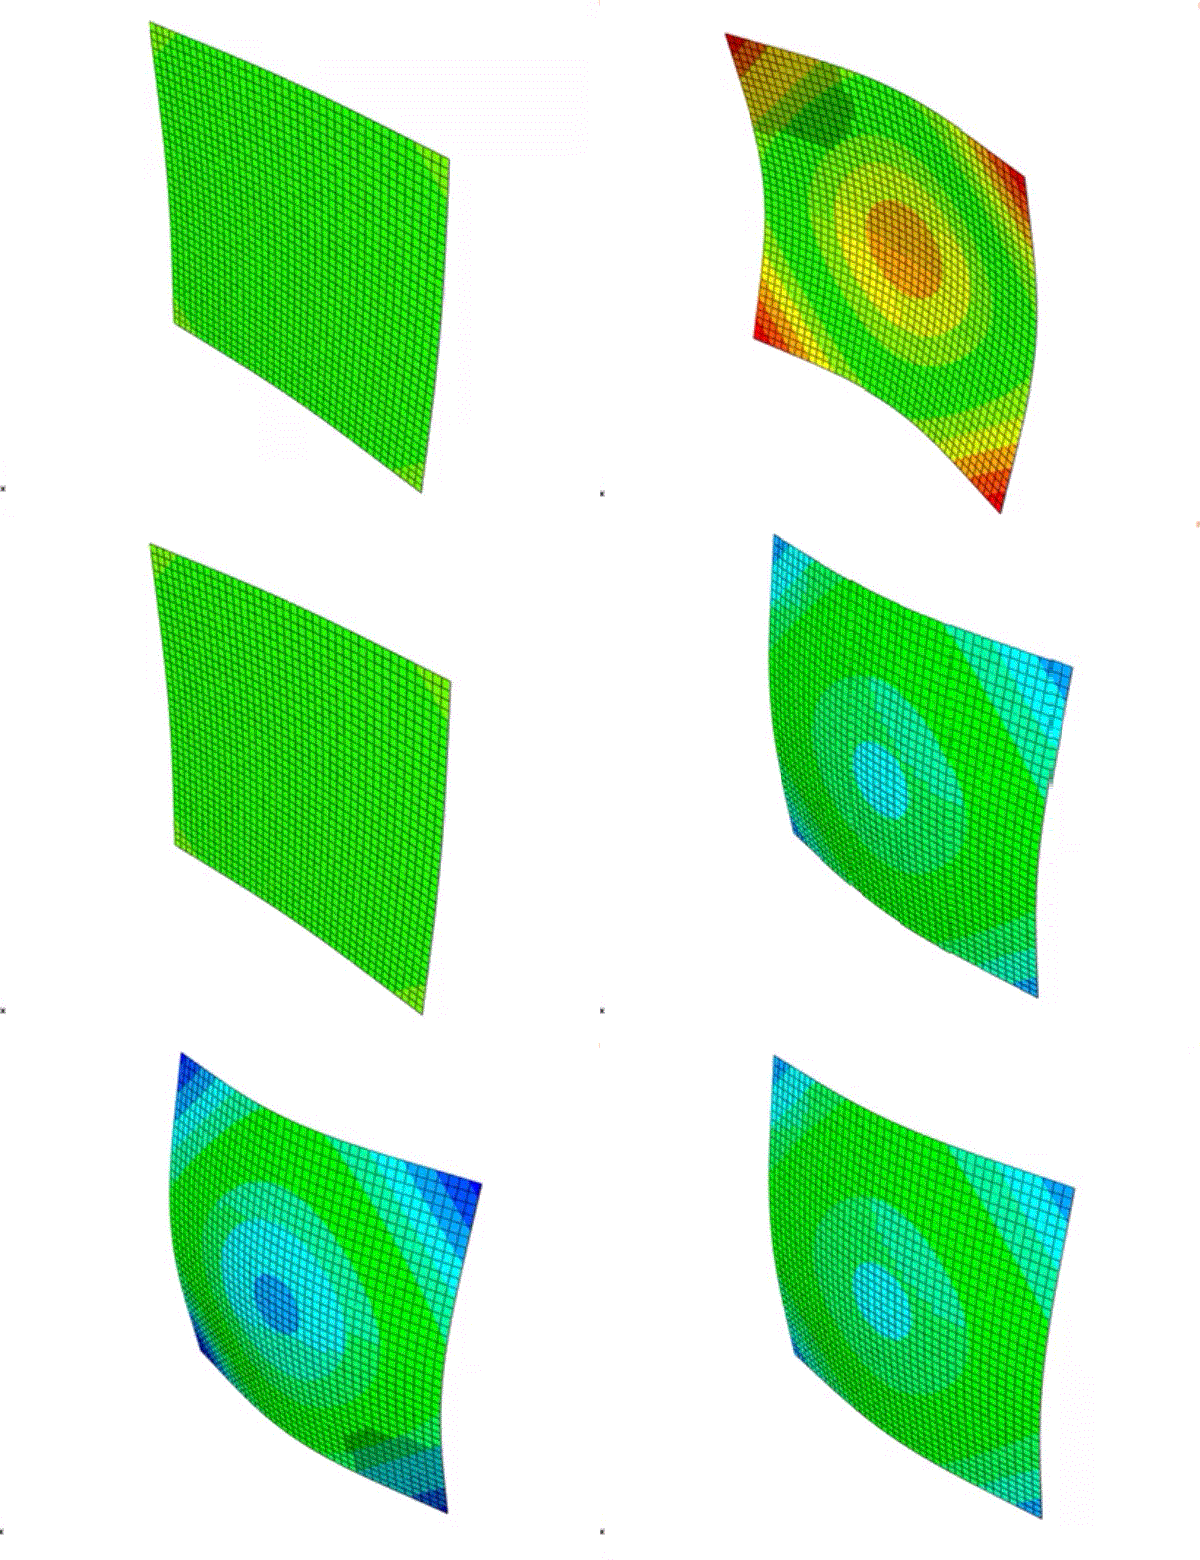
In this configuration, two modal shapes are easily excited (torsion and breathing) because they show a vibration amplitude in all the corners (see moving modal shapes below).
- Torsion Modal Shape
- Breathing Modal Shape
The measurement screen of the resonalyser shows two clear resonance peaks (in this example at 131 Hz and 303 Hz)
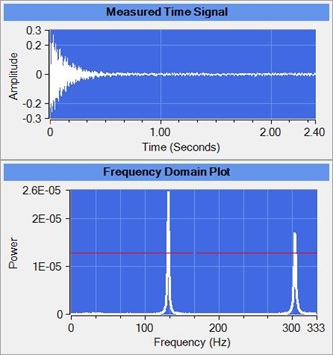
Time domain signal (above) and Frequency domain signal (under)
The resonalyser software can take the mass of the accelerometer into account in the numerical model. The user must indicate the value of the Mass and the position. In the example below the Mass value is 0.0012 kg and the position is Node number 73.
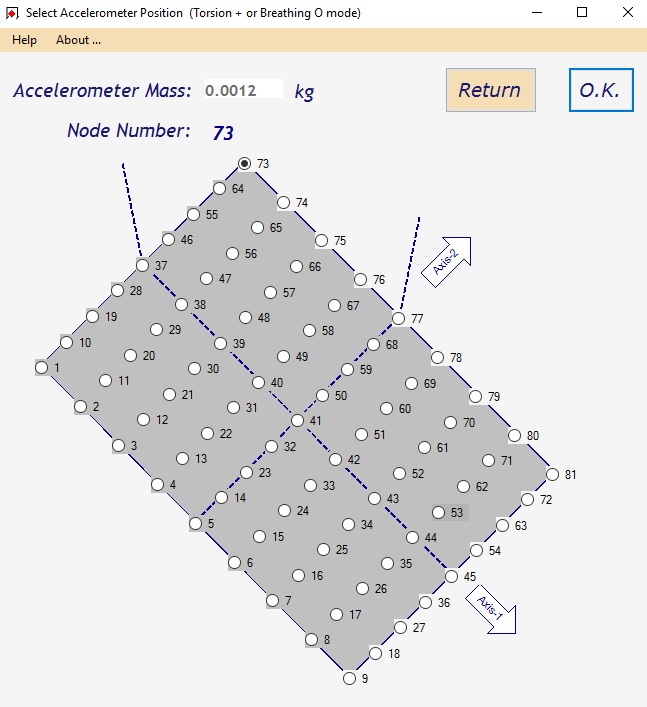
Position of the accelerometer (Resonalyser software screen)
2) Measurement of the frequency associated with the saddle modal shape
Vertical suspension of the plate. Fix the accelerometer in the middle of an edge of the plate and excite the plate in the middle of another edge.
In this configuration, the modal shape of the Saddle modal shape is easily excited because it shows a vibration amplitude in the middle of the edges (see moving modal shape below).
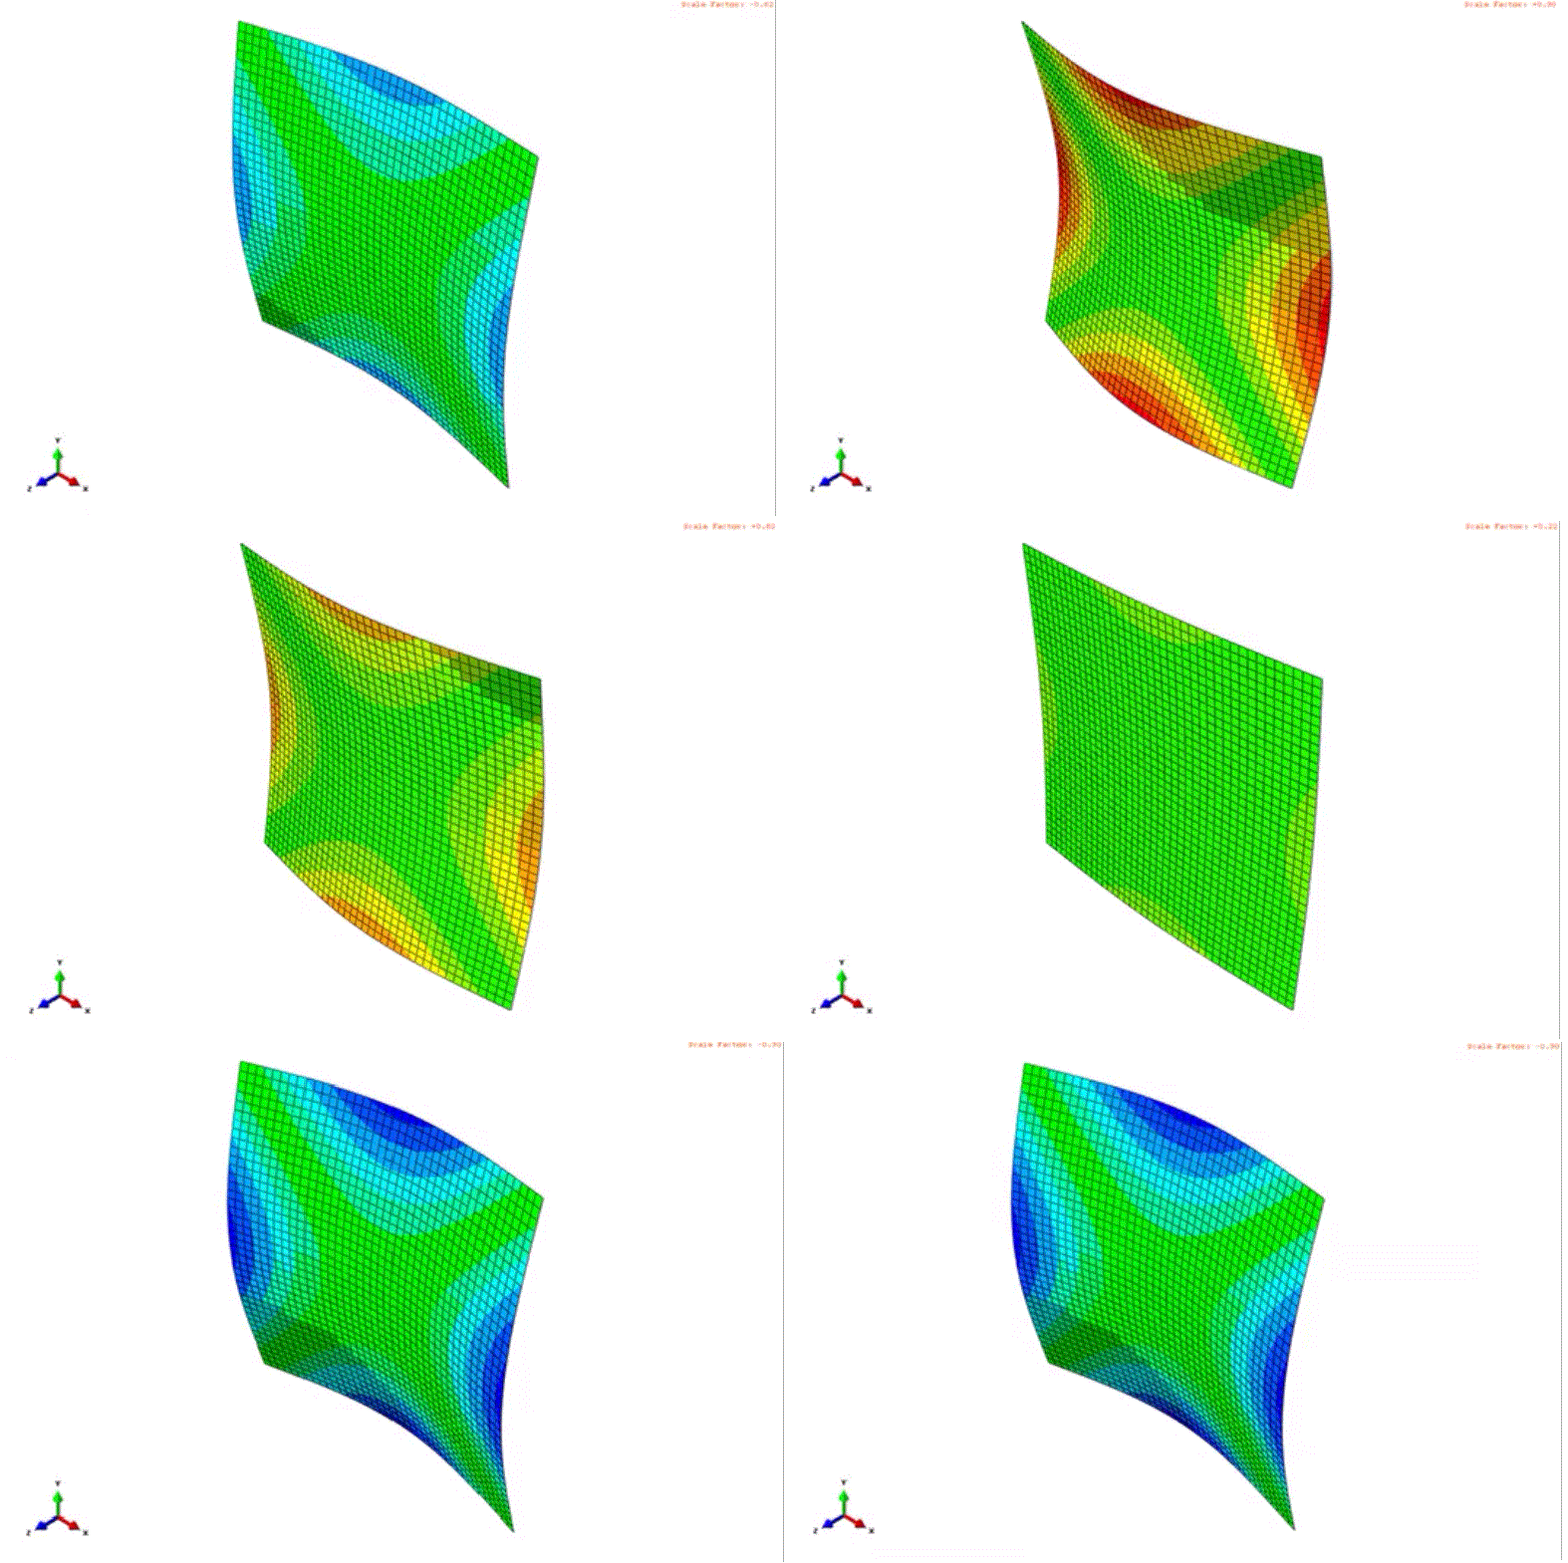
Saddle Modal Shape
The measurement screen of the resonalyser shows a clear resonance peak (in this example at 269 Hz).
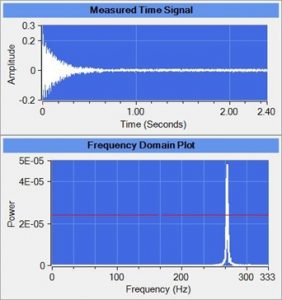
Time domain signal (above) and Frequency domain signal (under)
Again, the mass of the accelerometer can be taken into account. In the example below the Mass value is 0.0012 kg and the position of the accelerometer is in Node number 37.
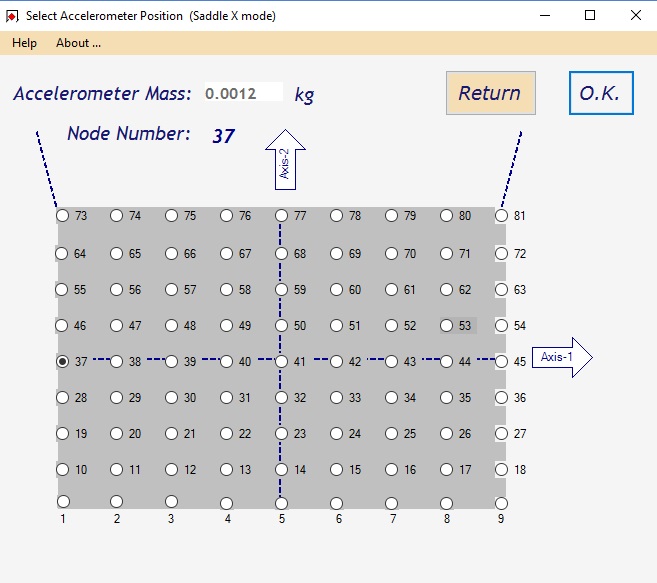
Position of the accelrometer (Resonalyser software screen)
3) Identification of the damping ratios associated with the modal shapes
The plate frequencies in combination with the beam frequencies allow the identification of the elastic part of the Engineering Constants. If the user is also interested in the damping part (imaginary part), the damping ratios associated with the plate frequencies must be measured. The Resonalyser software can curve fit the measured time domain signals to identify the damping ratio. The identification software works in the case of two simultaneous frequencies (Torsion and breathing) as well as for 1 frequency (Saddle modal shape). The figure below shows the simultaneous identification of the damping ratios of the torsion and breathing modal shapes (generated starting value in the right above part, final values in the columns below).
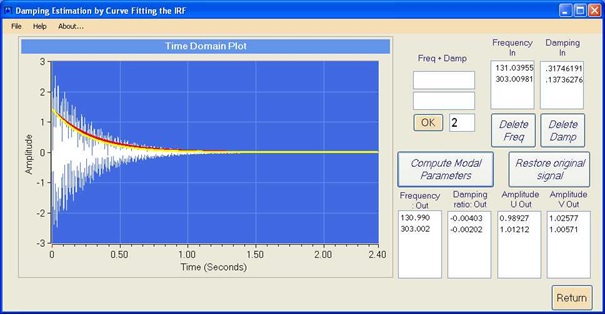
The plate measuring procedure hence delivers 3 resonance frequencies and optionally 3 associated damping ratios.

